
Track These 15 Advanced Web Metrics with Google Analytics in 2024!
These days, analytics platforms and metrics are like the bread and butter of every marketer’s gig. Now, ain’t nobody doing that “by ear” marketing anymore, or the number of these marketers is losing more and more ground to data-driven customer insights.
That’s why Google Analytics has become so popular, just as its metrics have become increasingly advanced and popular, whether we call them Google Analytics engagement metrics, acquisition metrics, or something else.
As an idea, 37.9 million websites are rockin’ Google Analytics.
Based on that, we’re gonna talk about 15 advanced metrics you can track in Google Analytics and trust us; there are some solid reasons why you should be all over these metrics.
What is an Advanced Web Metric?
An advanced web metric is a more sophisticated and in-depth measurement or analysis of website performance and user behavior data.
While basic web metrics provide fundamental information like what it is and that’s it, advanced web metrics delve deeper into specific aspects to uncover more actionable insights and facilitate data-driven decision-making.
Advanced web metrics typically involve using advanced analytics tools, such as Google Analytics, to gather and interpret data related to website performance, user engagement, conversions, and other key performance indicators (KPIs). These metrics provide:
- A more comprehensive understanding of how users interact with a website;
- The effectiveness of marketing campaigns;
- The overall success of digital strategies.
If you don’t get it, let’s take an example. Let’s say you run an e-commerce store and want to know if your marketing campaigns are paying off. Advanced web metrics offered, for example, by Google Analytics, got your back in this case. You can track metrics like revenue generated, average order value, and cart abandonment rate. These metrics show you how much money you’re making, how much customers are spending, and where they might drop off during checkout.
Why Using Advanced Web Metrics with Google Analytics is Vital for Your Business?
Well, it’s all about the insights.
Back in the day, businesses predominantly relied on sales to measure success in traditional marketing. They would occasionally conduct customer surveys to gain additional insights. However, marketing has undergone a significant transformation in today’s digital era. It has become highly digitized, with a complex web of platforms, channels, tools, and campaigns that drive user interactions and conversions.
Tracking and measuring conversions in this digital marketing have become both strategically crucial and complex for businesses. This is where Google Analytics steps in, wielding an impressive market share of around 78% based on a Statista report. It empowers website and app owners to track their goals and conversions, providing invaluable insights into what works and what doesn’t.
Source: Statista
It goes beyond just tracking conversions. Google Analytics (GA) allows businesses to gauge the performance of various digital marketing efforts, such as search engine optimization, blogging, paid advertising, influencer marketing, affiliate marketing, and social media marketing. With GA, everyone gains refined insights into multiple goals, using different reference frames to develop a deeper understanding of user behavior on your website and the overall customer journey.
Like your brand’s voice and business vision, your website’s activity, behavior, and conversion goals are unique and constantly evolving. That’s where GA comes in the clutch, helping you spot opportunities and fix any issues at every stage.
Types of Metrics in Google Analytics 4
To simplify the process of identification and establish meaningful connections, it’s important to understand that GA4 categorizes its metrics into four main types: acquisition metrics, engagement metrics, monetization metrics, and retention metrics.
These categories serve as a framework to organize and analyze the various metrics available, providing a comprehensive understanding of different aspects of your digital presence.
Google Analytics Acquisition Metrics
These metrics help you track how you acquire new customers and build brand awareness. Some important acquisition metrics, which we will also address below, include:
- Total and New Users;
- Sessions.
Google Analytics Engagement Metrics
Google Analytics engagement metrics focus on how your audience interacts with your website and content. Some examples of engagement metrics in GA4 are:
- Active Users;
- Pageview;
- Engaged Sessions;
- Engaged Sessions per User;
- Session Conversion Rate;
- Conversions;
- Event Count;
- Engagement Rate;
- Average Engagement Time;
- Exits;
- Bounce Rate.
Google Analytics Monetization Metrics
Monetization metrics help you measure revenue generation and how your clients make money. Key monetization metrics in GA4 include:
- Total Revenue;
- User Lifetime Value.
Google Analytics Retention Metrics
Retention metrics help you understand how well you retain users and how often they return to your website or app. They play a crucial role in evaluating the long-term success of your digital presence. Some retention metrics are:
- Returning Users.
Now, let’s delve into each of these metric types and explore them in depth.
Disclaimer. As you know, Google Universal Analytics collected data until July 1, 2023. So, obviously, all these advanced metrics which will present are available on Google Analytics 4 (there is a chance that some of them will not appear in this form in the UA).
Advanced Web Metrics with Google Analytics
1. Google Analytics Acquisition Metrics
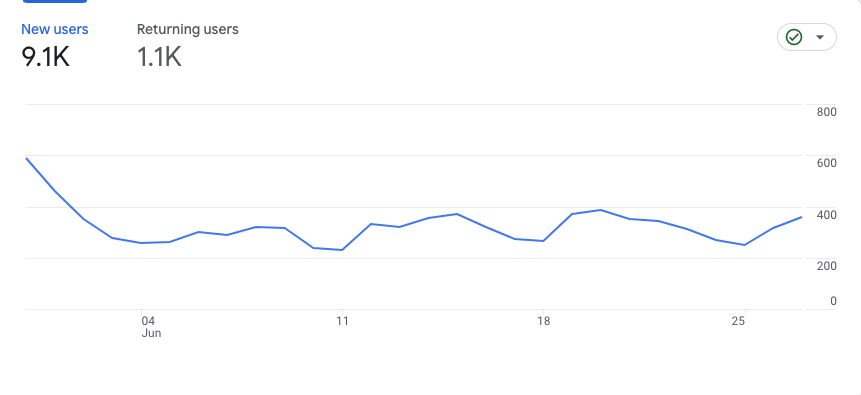
Total and New Users
GA4 has carried over two important metrics from Universal Analytics to its acquisition reports, serving a similar purpose – Total Users and New Users.
What Is It: Total Users represents the number of unique visitors interacting with your channel during a specific time frame. New Users, as the name suggests, track the number of first-time visitors to your site.
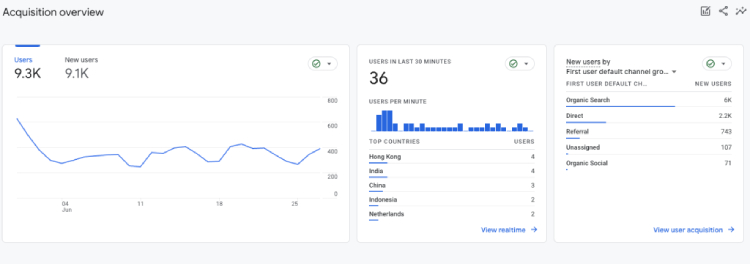
Where to Find in GA4: Navigate to Reports > Life cycle > Acquisition > Overview.
The Total Users and New Users metrics go beyond providing basic website traffic information – they can also offer valuable demographic data about your users. This data is crucial in creating targeted campaigns catering to their specific needs and cultural preferences. How’s that?
To present this importance, consider an example of an Indian automotive company launching a new car in the German market. They decided to release a commercial that showcases the car’s agility in traffic, filmed in an Indian traffic setting. However, if you have insights from Google Analytics, you might discover that your website already attracts some traffic from Germany due to your brand’s strength and domain presence in that country.
In this scenario, you realize that simply repurposing the Indian commercial for the German audience may not be effective due to cultural differences. Germans generally adopt a defensive driving style, unlike the more aggressive driving seen in the Indian commercial. By analyzing the demographic data from Google Analytics, you gain an understanding of the German audience’s preferences and behavior.
With this insight, you can tailor your marketing campaign to resonate better with the German market. You might create a new commercial highlighting the car’s safety feature or emphasizing fuel efficiency, which aligns with the values and driving culture of the German audience. This will give you a better understanding of why, in this case, the number of new users is growing and whether it is on the right track in penetrating that market.
Sessions
What Is It: In Google Analytics, a session represents the duration from when a user enters your site until they exit.
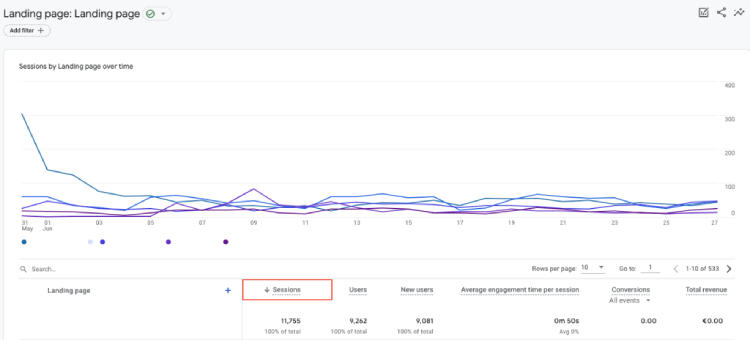
Where to Find in GA4: To access session data in GA4, navigate to Reports > Life Cycle > Engagement (or Reports > Life Cycle > Acquisition > Traffic acquisition).
While a session can also end after 30 minutes of user inactivity, there is no limit to how long a single session can last.
For example, let’s say a guest visits your homepage and explores your tour pages for five minutes. This activity will be recorded as one session in Google Analytics.
Sessions play a crucial role in evaluating your website’s overall traffic and engagement. In GA4, a session is also called a “session start.”
By examining the duration and engagement of sessions, you can determine how well your website engages visitors and retains their attention. If you notice that users frequently spend extended periods on your site and navigate through multiple pages, it indicates a high level of engagement and interest in your content.
Conversely, if the average session duration is short or users quickly exit after viewing only a single page, it may suggest a need to improve the user experience, enhance page content, or optimize calls to action to encourage further exploration.
2. Google Analytics Engagement Metrics
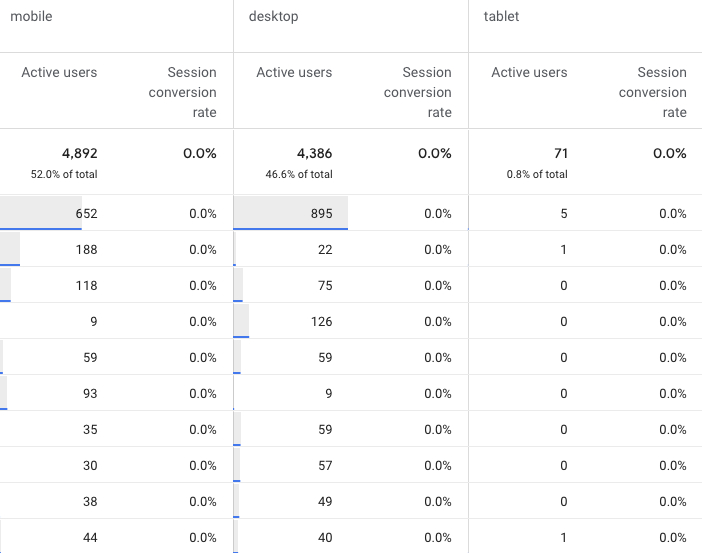
Active Users
There is often confusion between active and real-time users, with many assuming they are the same. However, it’s essential to understand that these two metrics are distinct.
What Is It: Real-time users refer to individuals currently browsing your website, while active users are those who had an engagement session (which we’ll define later) within a specific time frame.
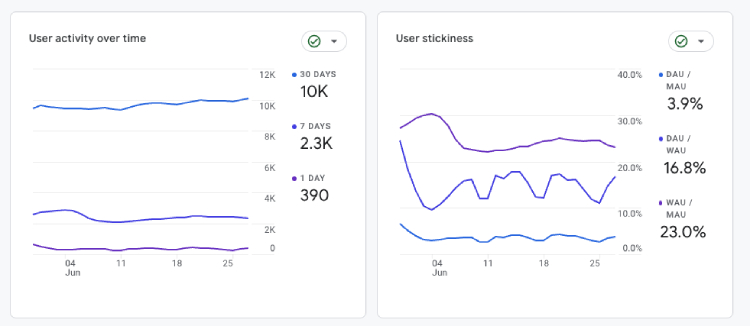
Where to Find in GA4: Navigate to Reports > Life cycle > Engagement > Overview.
In Google Analytics 4, active users are measured based on different periods, including one day, seven days, and 30 days. This allows you to analyze user engagement over these intervals and gain insights into your website’s level of activity and interaction.
For instance, if you launched a recent promotional campaign accompanied by strong branding efforts, you can quickly assess its success by referring to the chart. By analyzing the active user counts, you can determine if the campaign generated a notable increase in traffic and if the branding resonated with the audience, providing valuable insights for future decision-making and optimization.
Pageview
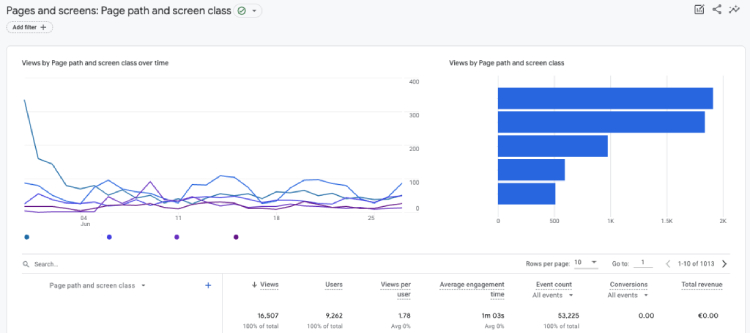
GA4 introduces a slight tweak to the definition of Pageview compared to Universal Analytics (UA).
What Is It: In UA, Pageview represents the total number of pages viewed, whereas GA4 combines the number of web pages viewed with screen views. So, when transitioning to GA4, if you notice a significant increase in Pageviews, it’s crucial to consider that GA4 combines both app and web views, whereas UA tracked them separately. It’s also important to note that in GA4, Views are the equivalent of Pageviews in UA.
Where to Find in GA4: Navigate to Reports > Life Cycle > Engagement > Pages and screens.
Pageviews are an advanced metric in GA4 because it provides a comprehensive view of user interactions across both web pages and screen views.
Imagine you have a mobile app for an e-commerce business, and you recently launched a new feature that allows users to browse products through a visually appealing carousel on the app’s home screen. In GA4, the Pageviews metric not only tracks the number of times users navigate to different web pages within the app but also includes the screen views of the home screen carousel.
By analyzing the Pageviews metric, you can gain valuable insights into user engagement and the effectiveness of the new feature. For instance, if you notice a substantial increase in Pageviews compared to the previous period, users are actively exploring the carousel and navigating various product pages. This insight suggests that the new feature has captured user interest and is driving increased engagement within the app.
On the other hand, if the Pageviews remain stagnant or decrease, it may indicate a need to optimize the carousel further or enhance its visibility to encourage more user interactions.
Engaged Sessions
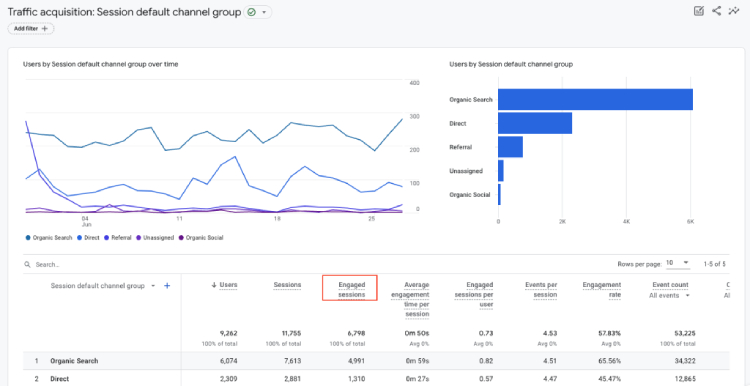
After initially exploring user acquisition and analyzing the sessions, we must shift our attention to user engagement. We need to determine whether these visitors actively engage with our content and experiences. Moreover, it’s not just about attracting them; we want to ensure they are fully immersed in and participating.
As we mentioned previously in the article engaged sessions, now it’s time to explain it because this can also be an advanced web metric with Google Analytics.
What Is It: Engaged Sessions refer to sessions that lasted 10 seconds or more or had at least one conversion event or two or more page or screen views. In other words, it represents sessions where users actively interacted with your website, indicating a higher level of engagement.
Where to Find in GA4: Navigate to Reports > Life Cycle > Engagement (or Reports > Life Cycle > Acquisition > Traffic acquisition).
How’s it an advanced metric? Suppose you have a content-based website offering educational articles and tutorials on various topics. One of your key goals is to increase user engagement and encourage users to spend more time exploring your content. In this case, you may want to analyze engaged sessions to see how users interact with different types of content, such as long-form articles, video tutorials, or interactive quizzes.
By comparing the number of engaged sessions across different content types, you can identify which formats resonate better with your audience and lead to higher engagement.
Engaged Sessions per User
What Is It: Intuitively, engaged sessions per user represent the average number of sessions in which users actively interact with your website or app. It quantifies user engagement by calculating the average count of sessions where users are actively involved and perform meaningful actions.
Where to Find in GA4: Navigate to Reports > Life Cycle > Engagement > Overview (or Reports > Life Cycle > Acquisition > Traffic acquisition).
Like the engaged sessions metric, this is an influential gauge of audience loyalty and engagement. It provides insights into the depth of interaction and interest of individual users with your website or app.
Whether you’re focusing on the engaged sessions metric or the engaged sessions per user (because you can track just one of them), both provide valuable insights, although they differ in their perspective. Engaged sessions per user give you a more holistic view by considering the average level of engagement for each individual user. Still, if you prefer a more precise and comprehensive count of user interactions, the engaged sessions metric provides the exact number of meaningful sessions.
Session Conversion Rate
What Is It: Session conversion rate is a metric that measures the percentage of sessions on a website that result in a conversion or goal completion.
Where to Find in GA4: You must create a custom report. Navigate to Explore > create a Free Form > add the session conversion rate metric next to the desired dimensions.
In Google Analytics, you can find your session conversion rate, labeled as “e-commerce conversion rate” if e-commerce tracking is enabled or “goal conversion rate” if your conversions are based on goal completions. For example, if you have 10,000 sessions monthly and 100 transactions, your session conversion rate would be 1%.
Do not confuse the session conversion rate with the conversion rate.
The key difference between them in Google Analytics lies in the scope of measurement. Session conversion rate looks explicitly at the percentage of sessions that result in a conversion, focusing on the rate of conversions within individual sessions. Conversion rate considers the percentage of total users or visitors who convert, considering multiple sessions per user. While session conversion rate focuses on conversions within sessions, conversion rate provides a broader view by considering conversions across all users.
Speaking about which one to choose, the choice of which metric to use depends on the specific analysis objectives and the level of granularity required for measuring and optimizing conversions.
Conversions
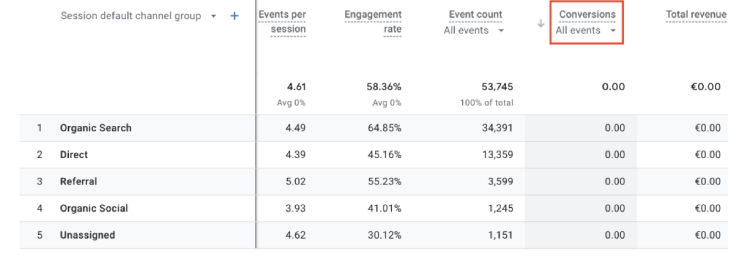
What Is It: Conversions are a fundamental metric in Google Analytics that measures the number of desired actions taken by visitors on your website. These actions can range from making a purchase to subscribing to a newsletter or booking a tour, depending on your specific goals.
Where to Find in GA4: Navigate to Reports > Life Cycle > Engagement > Conversions (or Reports > Life Cycle > Acquisition > Traffic acquisition).
In GA4, conversions are tied to the conversion events that you define.
Conversions play a vital role in assessing the effectiveness of your website and marketing strategies. They offer a practical understanding of the performance of your calls-to-action, landing pages, and the overall conversion funnel.
By tracking conversions, you can gauge how well your website drives the desired user actions and identify areas for improvement.
Event Count
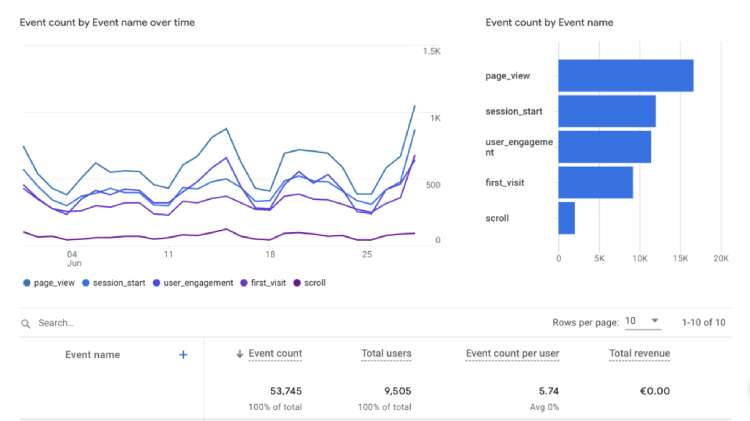
What Is It: Events count represents the number of specific actions visitors take on your websites, such as button clicks, file downloads, or form submissions.
Where to Find in GA4: Navigate to Reports > Life Cycle > Engagement > Events.
In Google Analytics 4, events are crucial in understanding user interactions and optimizing your website for better user experience and conversions.
Tracking and analyzing events can help you to gain insights into how guests engage with your website and identify the most popular features.
For a better understanding of this advanced metric, let’s say you have an e-learning platform, and one of your conversion goals is for users to sign up for a free trial. By tracking events such as “Sign Up Button Clicked” or “Trial Request Form Submitted,” you can measure the effectiveness of your signup process. If you notice a high event count for these specific actions, it indicates strong user interest and engagement with your trial offer, but if the event count for these actions is low, it may suggest areas for improvement, such as optimizing the signup form or making the process more visible on your website.
Furthermore, tracking events can help you identify user behavior patterns and preferences. For instance, if you have events set up for different features or sections of your website, you can analyze which events are triggered more frequently.
Engagement Rate
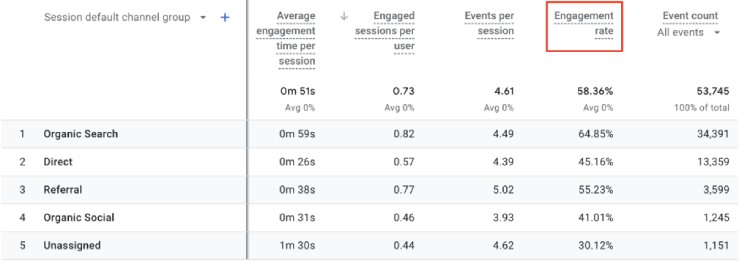
What Is It: Engagement rate refers to the percentage of engaged sessions compared to the total number of sessions on your website or app. It provides insights into user interaction and interest in your content, indicating how effectively your channels encourage and retain user engagement.
Where to Find in GA4: Navigate to Reports > Life Cycle > Engagement > Overview (requires manual addition to display) or Reports > Life Cycle > Acquisition > User acquisition.
Represented as a percentage, the engagement rate allows you to assess the effectiveness of your channels in encouraging user engagement and keeping them interested in your pages or screens.
As you can sense, a higher engagement rate indicates that your channels effectively capture and retain user attention, foster meaningful interactions, and encourage them to explore further. This metric helps you identify the areas where your website or app excels in engaging users and can serve as a benchmark for future improvements.
For example, let’s consider an e-commerce website that wants to assess the engagement rate of its product pages. They can calculate the engagement rate for these pages by analyzing the engaged sessions and session data. A higher engagement rate indicates that visitors spend more time on the product pages, interacting with elements like images, descriptions, and reviews. This insight suggests that the content and presentation of the products are captivating to users, potentially leading to increased conversions.
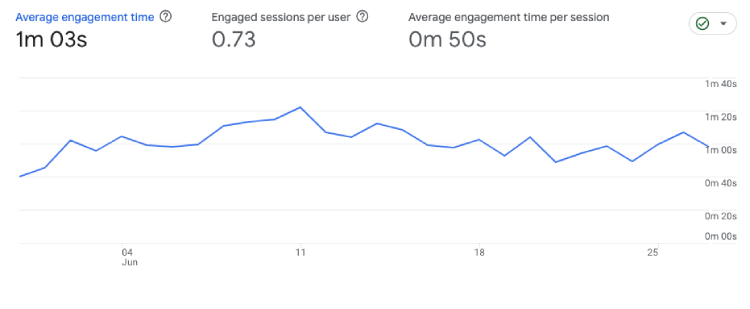
Average Engagement Time
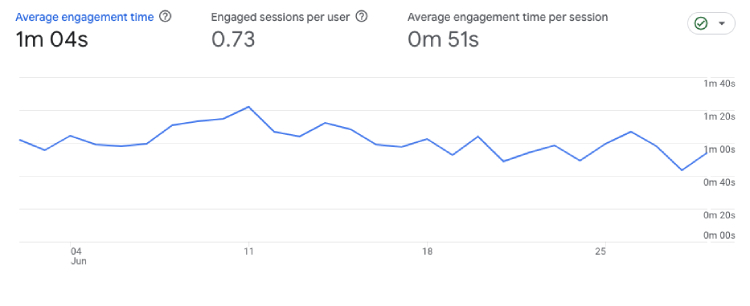
What Is It: The average engagement time represents the average length of time that a web browser spends interacting with your website. This metric focuses specifically on users who actively engage with your site or have participated in a session with significant involvement.
Where to Find in GA4: Navigate to Reports > Life Cycle > Engagement > Overview.
In Universal Analytics, you could view the average session duration or the average amount of time users spent browsing your site. However, now in GA4, you have an enhanced capability to precisely determine the period during which these users are actively engaged with your site rather than just having it open in the foreground. This provides a more accurate measure of user engagement.
It’s an advanced metric that has developed in GA4 compared to UA, and it’s best suited for people who want to know how much time users spend on the site or in the app.
Exits
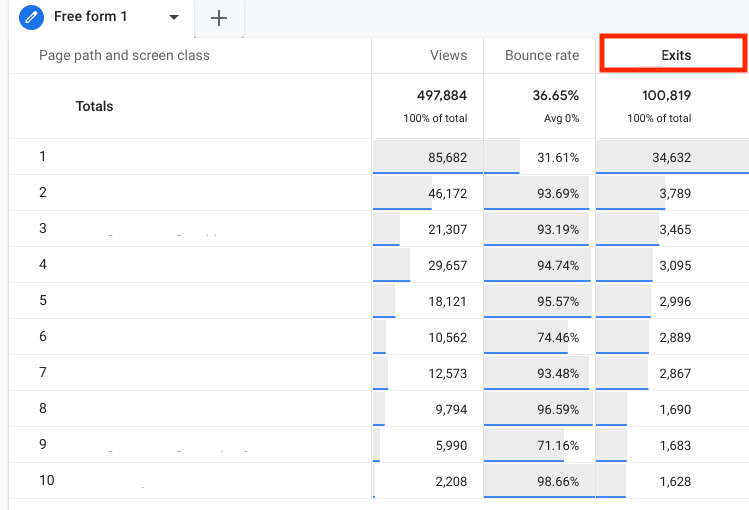
What Is It: The exits represent the number of website visitors who leave your site from specific pages.
Where to Find in GA4: You must create a custom report. Navigate to Explore > create a Free Form > add the exits metric next to the desired dimensions.
Since users do not stay online indefinitely, every page is expected to have an exit. However, high exits may indicate potential performance issues with your website.
It is important to note that exits and bounce rates differ not only in their numerical representation but also in the insights they provide about user behavior on a website.
Exits can occur regardless of the number of pages a user has visited, as it focuses on the last page of their session.
On the other hand, the bounce rate measures the percentage of visitors who enter a website and leave without interacting with any other pages. It explicitly tracks single-page sessions where users do not navigate beyond the landing page.
Bounce Rate
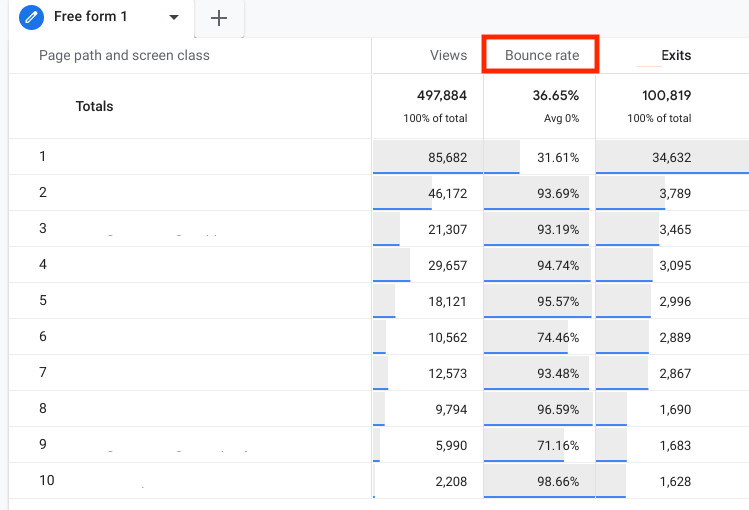
What Is It: As mentioned above, bounce rate represents the percentage of single-page visits in which users arrive on a page but do not engage in any events or navigate to other pages.
Where to Find in GA4: You must create a custom report. Navigate to Explore > create a Free Form > add the bounce rate metric next to the desired dimensions.
Bounce rate is especially essential for e-commerce companies. The higher the bounce rate, the worse it is, meaning that visitors are not finding the content they expected, that the content is not engaging enough to encourage further exploration, or that your landing page needs optimization, indicating a need for conversion rate optimization, or others.
Not to be confused with exits (explanation above).
3. Google Analytics Monetization Metrics
Total Revenue
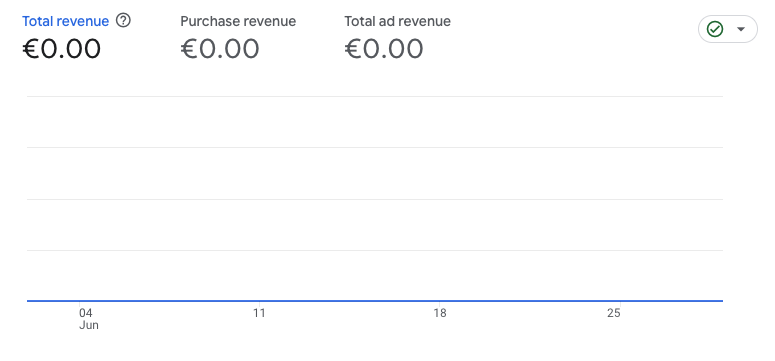
In one of his songs, the musical artist Donnie expressed a funny but meaningful belief: “No money, no funny.” This belief also holds when considering a company’s total revenue.
What Is It: Total revenue represents a monetization metric that shows the cumulative revenue encompassing purchases, subscriptions, and advertising, which is calculated by adding the revenue from purchases, subscriptions, and advertising together.
Where to Find in GA4: Navigate to Reports > Monetization > Overview.
This metric can grow in complexity as revenue sources on a website expand and as brand recognition increases. While e-commerce companies commonly monitor it, it is valuable to introduce this metric in the article to highlight its significance for various other types of businesses as well.
It validates whether or not a business is producing something, and based on it, you can raise a red flag so it doesn’t end up with the “no money, no funny” story.
User Lifetime Value (LTV)
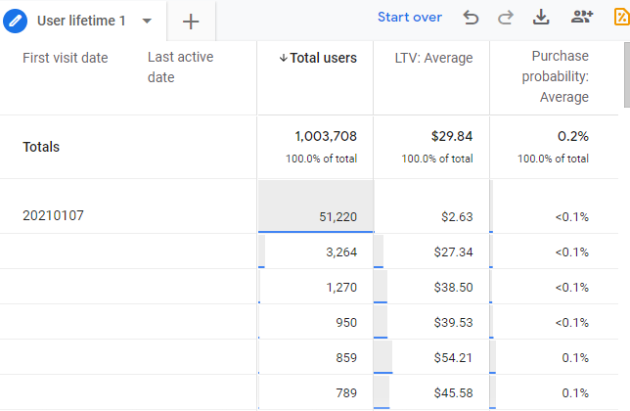
What Is It: User lifetime value (LTV) is the metric that signifies the overall revenue your business has generated from a specific user over their entire relationship with your company.
Where to Find in GA4: You must create a custom report. Navigate to Explore > create a Free Form > add the user lifetime metric next to the desired dimensions.
User lifetime value is important as it quantifies the total revenue a business can expect to generate from an individual customer, guiding decision-making for marketing, retention, and overall business growth.
4. Google Analytics Retention Metrics
Returning Users
What Is It: Returning users, also known as established users, refer to individuals who have previously visited your website and are now revisiting it. These users are identified and classified as returning users using the “New/Established” dimension in GA4.
Where to Find in GA4: In order to find returning users in GA4, you must navigate to Reports > Retention.
Even if many people do not consider it or it’s not classified as an advanced metric, it is, especially for companies from the e-commerce sector, subscription-based services, online marketplaces, content-driven websites, or mobile apps.
Without tracking this metric, companies will not be able to know if their strategy gains sustainable growth, gauge customer satisfaction, measure churn rates, and identify opportunities for improving customer retention.
Many small companies don’t focus on retention right from the first users, and this is a mistake because returning users can also show the trustworthiness of the product or service and validate it (especially a product) right from the beginning.
How Many Metrics Should I Track?
The answer to that question is like a needle in a haystack. Everyone’s on the hunt for the magic number, but here’s the truth: there isn’t just one answer. It all depends on your goals, business type, what you want to achieve with each metric, and more.
You might miss out on important insights if you track too few metrics. But if you go overboard and track too many, you’ll drown in a sea of data and get stuck in analysis paralysis. So, finding the sweet spot is key. You gotta focus on the metrics that really matter and align with your business type, objectives, purpose, etc.
To figure out how many metrics to track, start by nailing down your goals. Are you all about website traffic, conversions, user behavior, or crushing those campaigns? Once you’ve sorted that, you can pick the metrics that make sense and measure your progress.
Also, consider the context of your business and industry as well. Different industries may prioritize different metrics based on their specific goals and customer journey. For example, e-commerce businesses may focus on conversion rates and average order value, while content-based websites may emphasize engagement metrics such as time on page.
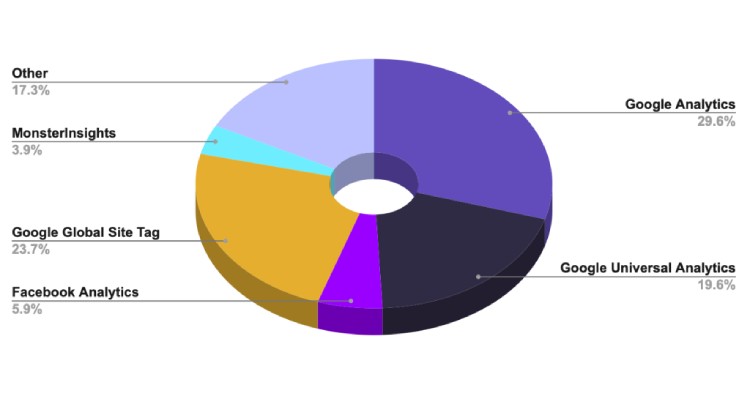
We can give you a heads-up. You can check out this HubSpot study because they’ve got the lowdown on the most popular advanced metrics that people are tracking. It can give you a solid starting point and some ideas to consider.
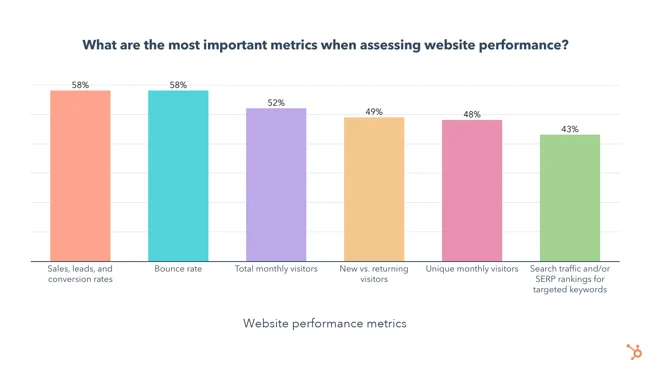
Source: HubSpot
Remember, the name of the game is getting insights that you can actually use to make smart decisions. So, don’t stress about tracking a gazillion metrics. You can start with the ones in the image and then adapt them according to the above.
Final Thoughts
So, there you have it, our fellow data-driven hustlers. We’ve explored the world of advanced web metrics in Google Analytics, and now it’s time to take action.
Although you wouldn’t want to use all of these metrics, at least half of them should be included in your strategy for analyzing your company’s marketing performance.
As we mentioned before, remember data is the game’s name, and with Google Analytics by your side, you’re equipped to dominate the online realm like a boss.