
Top Web Analytics Metrics for Growth in GA4
These days, analytics platforms and digital marketing analytics are the bread and butter of every marketer’s gig. Nobody is doing marketing by ear anymore, and these marketers are losing ground to data-driven customer insights.
That’s why tracking some of the top web analytics metrics has become so popular, whether we call them GA4 engagement metrics, acquisition metrics, or something else. To give you a rough idea, 37.9 million websites are rockin’ Google Analytics.
Based on that, we’ll discuss some of the most essential Google web metrics to get started on the right track. So, let’s jump in!
Table of Contents
Top GA4 Acquisition Metrics
These acquisition web analytics metrics help you track how you acquire new customers and build brand awareness. Some important acquisition metrics we will address below include Total, New Users, and Sessions.
1. Total and New Users
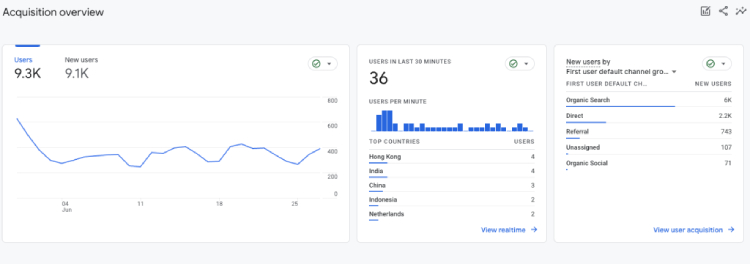
What it is: Total Users represent the number of unique visitors interacting with your channel during a specific time frame. As the name suggests, New Users track the number of first-time visitors to your site.
Where to find in GA4: Reports > Life cycle > Acquisition > Overview.
The Total Users and New Users metrics go beyond providing basic website traffic information—they can also offer valuable demographic data about your users.
The data is crucial in creating targeted campaigns that cater to their needs and cultural preferences and will help you better understand why new users are growing and whether you are on the right track to penetrating that market.
2. Sessions
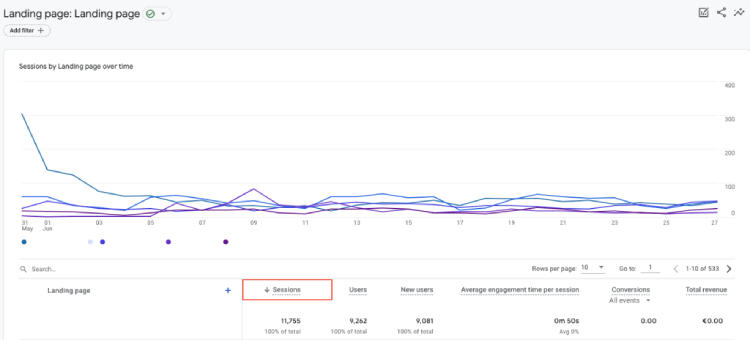
What it is: In Google Analytics, a session represents the duration from when a user enters your site until they exit.
Where to find in GA4: Reports > Life Cycle > Engagement (or Reports > Life Cycle > Acquisition > Traffic acquisition).
By examining the duration and engagement of sessions, you can determine how well your website engages visitors and retains their attention. If you notice that users frequently spend extended periods on your site and navigate through multiple pages, it indicates a high engagement and interest in your content.
11 Best GA4 Engagement Metrics
GA4 web analytics engagement metrics focus on how your audience interacts with your website and content. But let’s get a detailed view of these advanced engagement metrics and how they impact you.
1. Active Users
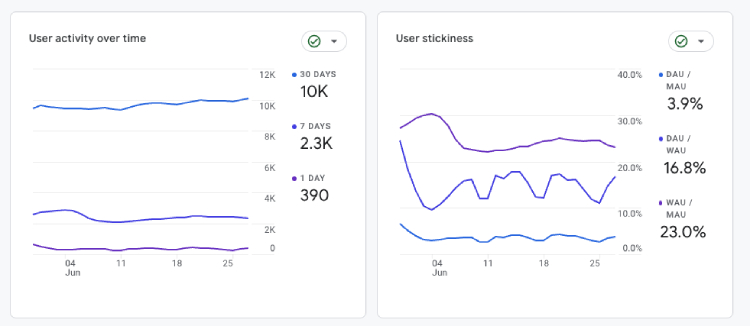
What it is: Real-time users refer to individuals currently browsing your website, while active users are those who had an engagement session (which we’ll define later) within a specific time frame.
Where to find in GA4: Reports > Life cycle > Engagement > Overview.
Many people are often confused between active and real-time users, assuming they are the same. However, it’s essential to understand that these two metrics are distinct.
In Google Analytics 4, active users are measured over different periods, including one day, seven days, and 30 days. This allows you to analyze user engagement over these intervals and gain insights into your website’s level of activity and interaction.
Practical Tip for Active Users
Analyzing the active user counts can help you determine whether the campaign generated a notable increase in traffic and whether the branding resonated with the audience. This provides valuable insights for future decision-making and optimization.
2. Pageview
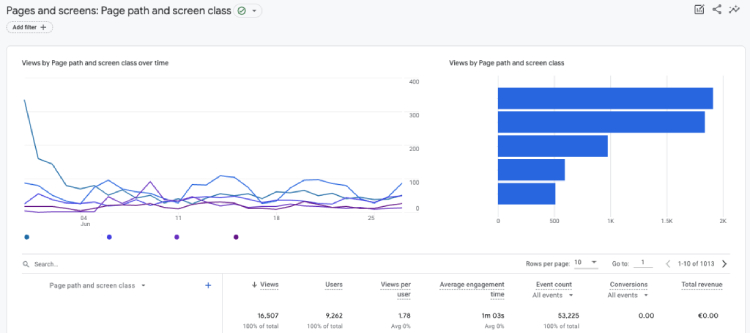
What it is: In UA, Pageview represents the total number of pages viewed, whereas GA4 combines the number of web pages viewed with screen views.
Where to find in GA4: Navigate to Reports > Life Cycle > Engagement > Pages and screens.
Pageviews are an advanced web analytics metric in GA4 because they comprehensively view user interactions across web pages and screen views. Analyzing the Pageviews metric can provide valuable insights into user engagement and the effectiveness of the new feature.
How to Boost Page Views
To increase page views, several key tactics can help capture attention and encourage users to explore more content.
- Featuring related content in the sidebar to keep users engaged while analyzing the content metrics as well;
- Adding internal links to guide visitors through relevant pages;
- Crafting compelling headlines to attract clicks;
- Enhancing site navigation for a smoother user experience;
- Posting more frequently to provide fresh content.
These methods create a more engaging site experience, encouraging users to view additional pages.
3. Engaged Sessions
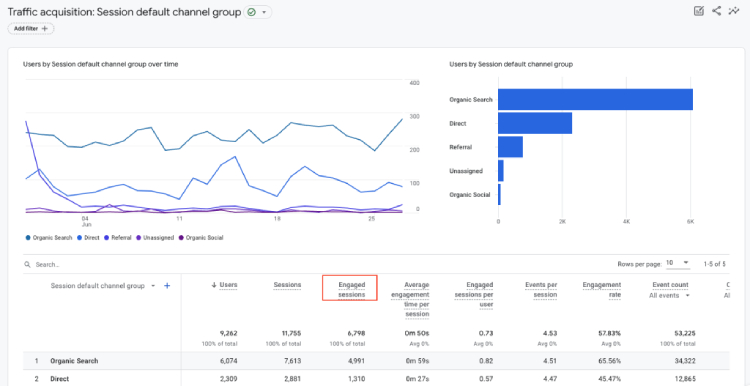
What it is: Engaged Sessions refer to sessions that lasted 10 seconds or more or had at least one conversion event or 2 or more page or screen views. In other words, it represents sessions where users actively interacted with your website, indicating a higher level of engagement.
Where to find in GA4: Reports > Life Cycle > Engagement (or Reports > Life Cycle > Acquisition > Traffic acquisition).
One of your key goals is to increase user engagement and encourage users to explore your content. You may want to analyze engaged sessions to see how users interact with different types of content.
4. Engaged Sessions per User
What it is: The average number of sessions users actively interact with your website or app. It quantifies user engagement by calculating the average count of sessions where users are actively involved and perform meaningful actions.
Where to find in GA4: Reports > Life Cycle > Engagement > Overview (or Reports > Life Cycle > Acquisition > Traffic acquisition).
Like the engaged sessions metric, this is an influential gauge of audience loyalty and engagement. It provides insights into the depth of interaction and interest of individual users with your website or app.
Whether you’re focusing on the engaged sessions metric or the engaged sessions per user (because you can track just one of them), both provide valuable insights, although they differ in their perspective.
Practical Tips for Boosting Engagement per User
- Develop in-depth, informative content that addresses user intent and comprehensively answers their questions.
- Enhance your website’s design and usability to ensure it is intuitive and easy to navigate.
- Incorporate internal links within your content to guide users to related topics, encouraging them to explore more of your site.
- Engage users with polls, quizzes, and videos encouraging interaction and extending their time on the site.
- Use popups to capture users’ attention before they leave, offering incentives to stay longer or explore additional content.
- Use targeted email campaigns to drive traffic to your site, promoting new content or related articles that encourage deeper engagement.
- Use retargeting ads to bring back users who have visited your site but did not engage fully, reminding them of content they may find valuable.
- Regularly review analytics to understand how users interact with your site, allowing you to make informed adjustments that enhance engagement.
Implementing these strategies can create a more engaging environment that encourages users to spend more time on your site.
5. Session Conversion Rate
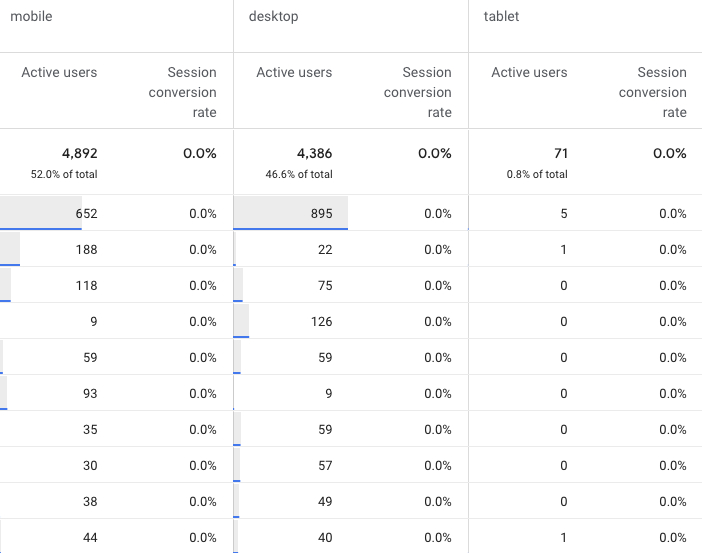
What it is: Session conversion rate is a metric that measures the percentage of sessions on a website that result in a conversion or goal completion.
Where to find in GA4: Create a custom report > Explore > Create a Free Form > Add the session conversion rate to the desired dimensions.
In Google Analytics, you can find your session conversion rate, labeled as “e-commerce conversion rate” if e-commerce tracking is enabled or “goal conversion rate” if your conversions are based on goal completions.
For example, if you have 10,000 sessions monthly and 100 transactions, your session conversion rate would be 1%.
However, do not confuse the session conversion rate with the conversion rate. The key difference between them in Google Analytics lies in the scope of measurement. While session conversion rate focuses on conversions within sessions, conversion rate provides a broader view by considering conversions across all users.
The choice of metric depends on the specific analysis objectives and the level of granularity required for measuring and optimizing conversions.
6. Conversions
What it is: Conversions are a fundamental metric in Google Analytics that measures the number of desired actions taken by visitors on your website.
Where to find in GA4: Reports > Life Cycle > Engagement > Conversions (or Reports > Life Cycle > Acquisition > Traffic acquisition).
Conversions play a vital role in assessing the effectiveness of your website and marketing strategies. Depending on your specific goals, these actions can range from purchasing to subscribing to a newsletter or booking a tour.
They offer a practical understanding of the performance of your calls-to-action, landing pages, and the overall conversion funnel.
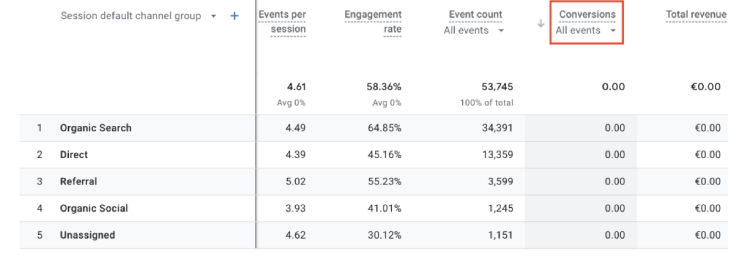
7. Event Count
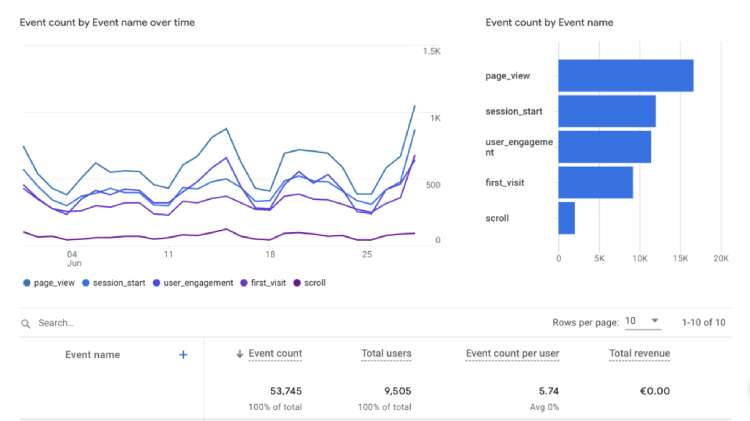
What it is: Events count represents the number of specific actions visitors take on your websites, such as button clicks, file downloads, or form submissions.
Where to find in GA4: Reports > Life Cycle > Engagement > Events.
In Google Analytics 4, the event count is tracked by adding an event tracking code to the elements you want to monitor on your website. This code creates an event whenever a user interacts with the designated element.
Thus, you gain insights into how guests engage with your website, identify the most popular features, and also helps you identify user behavior patterns and preferences.
Practical Tips for Event Count
- Regularly check event count reports to understand user interactions with key elements.
- Identify features with low event counts and consider redesigning them for better visibility.
- Improve user actions, like form submissions, by making them easier or clearer.
- Use insights from event counts to inform changes that boost engagement and conversions.
- Monitor event counts after making adjustments to evaluate their effectiveness.
8. Engagement Rate
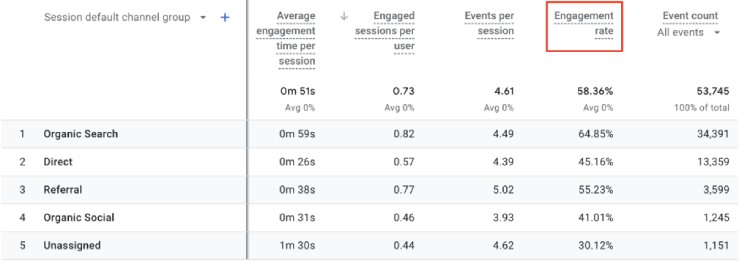
What it is: Engagement rate refers to the percentage of engaged sessions compared to the total number of sessions on your website or app. It provides insights into user interaction and interest in your content, indicating how effectively your channels encourage and retain user engagement.
Where to find in GA4: Reports > Life Cycle > Engagement > Overview (requires manual addition to display) or Reports > Life Cycle > Acquisition > User acquisition.
The engagement rate, represented as a percentage, allows you to assess the effectiveness of your channels in encouraging user engagement and keeping them interested in your pages or screens.
Practical Tip
If you notice a high bounce rate but your content seems powerful, start by checking the page load speed. A slow website can quickly deter users from staying on your site.
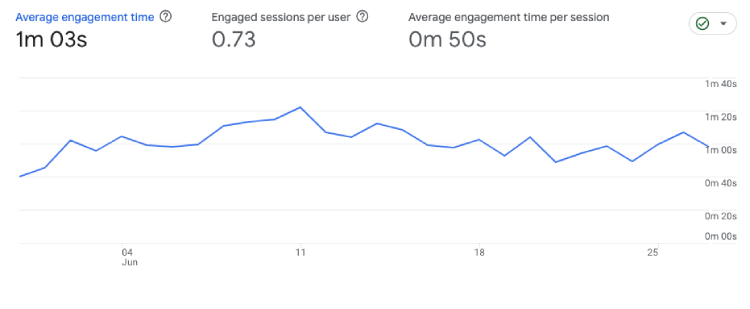
9. Average Engagement Time
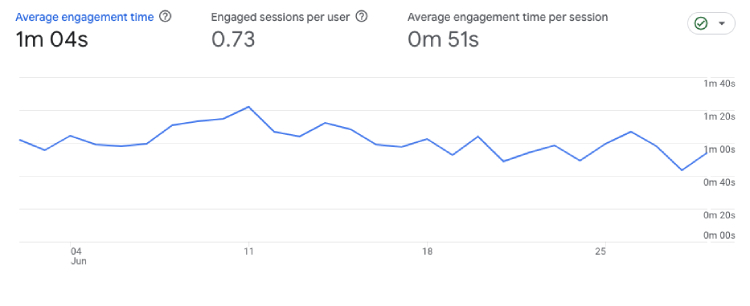
What it is: The average engagement time represents the average time a web browser spends interacting with your website. This metric focuses specifically on users who actively engage with your site or have participated in a session with significant involvement.
Where to find in GA4: Reports > Life Cycle > Engagement > Overview.
In GA4, you have an enhanced capability to precisely determine the period during which these users are actively engaged with your site rather than just having it open in the foreground. This provides a more accurate measure of user engagement.
Is one of those advanced web analytics metrics developed in GA4 and best suited for people who want to know how much time users spend on the site or in the app.
How to Increase Average Engagement Time
- Ensure your website is mobile-friendly and responsive for seamless browsing on all devices.
- Place compelling calls-to-action strategically to guide users and encourage further interaction.
- Tailor content and recommendations based on user behavior to make browsing more relevant.
- Provide downloadable resources like eBooks and guides to keep users engaged.
- Build a community through forums and social media integration to encourage return visits.
- Regularly review user behavior and engagement metrics to refine your strategies and content.
10. Exits
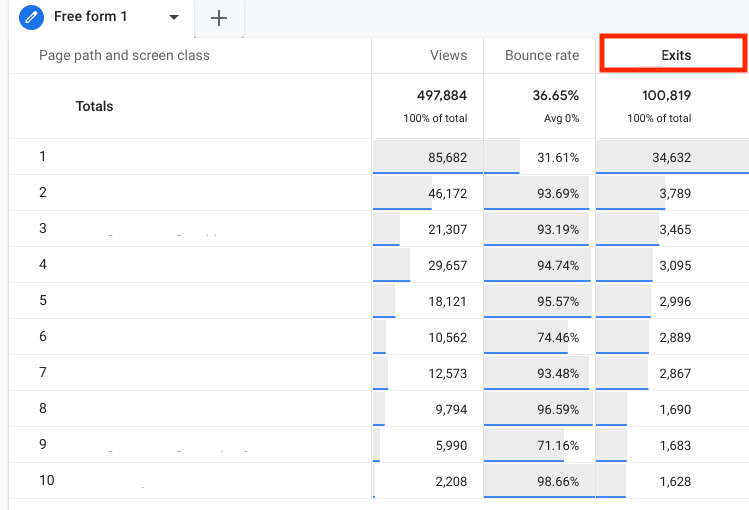
What it is: Exits represent the number of website visitors who leave your site from specific pages.
Where to find in GA4: Explore > Create a Free Form > Add exits next to the desired dimensions.
Since users do not stay online indefinitely, every page is expected to have an exit. However, high exits may indicate potential performance issues with your website. Thus, they can occur regardless of the number of pages a user has visited, as it focuses on the last page of their session.
11. Bounce Rate
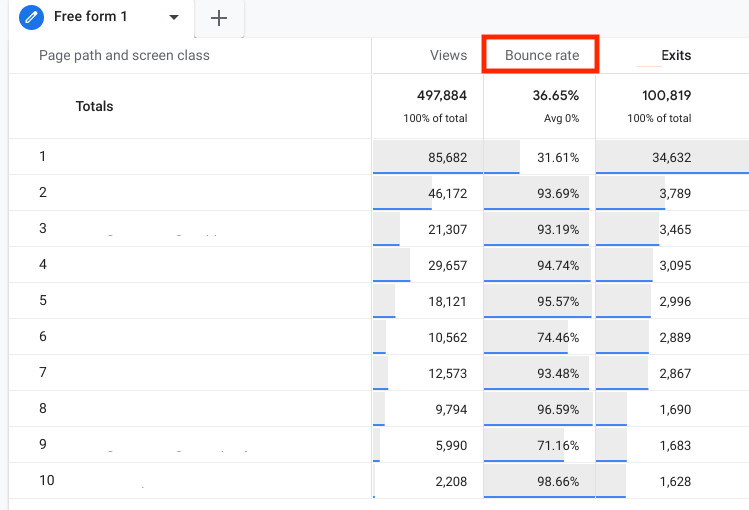
What it is: Bounce rate represents the percentage of single-page visits in which users arrive on a page but do not engage in any events or navigate to other pages.
Where to Find in GA4: Explore > Create a Free Form > Add bounce rate next to the desired dimensions.
Bounce rate is especially essential for e-commerce companies. The higher the bounce rate, the worse it is, meaning that visitors are not finding the content they expected or that your landing page needs optimization, indicating a need for conversion rate optimization.
The Best GA4 Monetization Metrics
1. Total Revenue
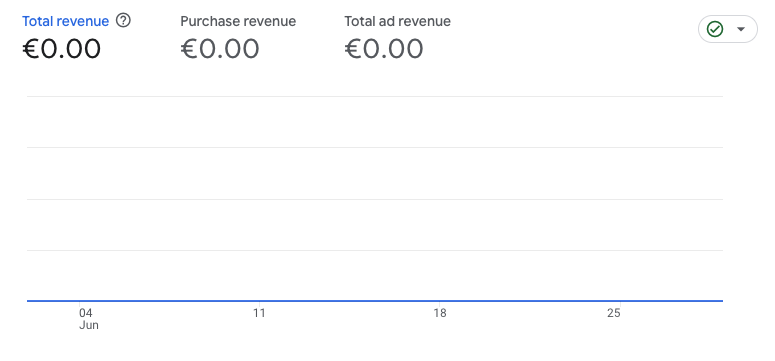
What it is: Total revenue is a monetization metric that shows the cumulative revenue encompassing purchases, subscriptions, and advertising, which is calculated by adding the revenue from purchases, subscriptions, and advertising.
Where to Find in GA4: Reports > Monetization > Overview.
This metric can grow in complexity as revenue sources on a website expand and as brand recognition increases. While e-commerce companies commonly monitor it, it is valuable to introduce this metric in the article to highlight its significance for various other types of businesses.
It validates whether or not a business is producing something, and based on it, you can raise a red flag so it doesn’t end up with the “no money, no funny” story.
2. User Lifetime Value (LTV)
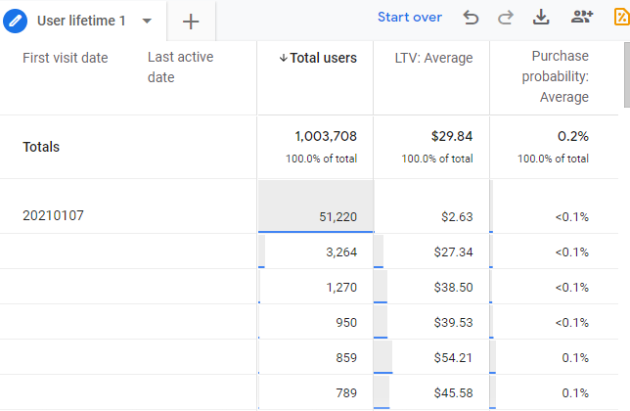
What it is: User lifetime value (LTV) is the metric that signifies the overall revenue your business has generated from a specific user over their entire relationship with your company.
Where to Find in GA4: Explore > Create a Free Form > Add the user lifetime metric next to the desired dimensions.
User lifetime value is important as it quantifies the total revenue a business can expect to generate from an individual customer. It guides decision-making for marketing, retention, and overall business growth.
4. Google Analytics Retention Metrics
Returning Users
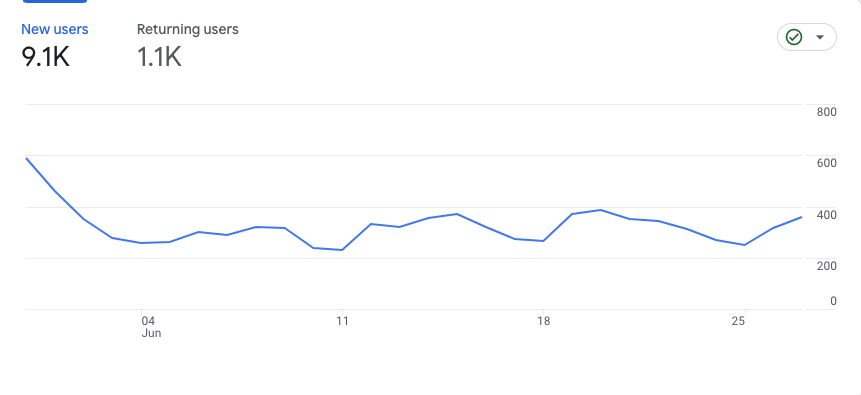
What it is: Returning users, also known as established users, refer to individuals who have previously visited your website and are now revisiting it. These users are identified and classified as returning users using the “New/Established” dimension in GA4.
Where to Find in GA4: Reports > Retention.
Although many people do not consider it one of those advanced web analytics metrics, it is, especially for companies in the e-commerce sector, subscription-based services, online marketplaces, content-driven websites, or mobile apps.
Without tracking this metric, companies cannot determine whether their strategy achieves sustainable growth, gauge customer satisfaction, measure churn rates, and identify opportunities for improving customer retention.
Many small companies don’t focus on retention right from the first users, and this is a mistake because returning users can also show the trustworthiness of the product or service and validate it (especially a product) right from the beginning.
How Many Web Analytics Metrics Should I Track?
The answer to that question is like a needle in a haystack. Everyone’s on the hunt for the magic number or trackable web analytics metrics, but here’s the truth: there isn’t just one answer. It depends on your goals, business type, your goal with each metric, and more.
But let’s find out some practical tips:
Nail Down Your Goals
Are you all about website traffic, conversions, user behavior, or crushing those campaigns? Once you’ve sorted that, you can pick the metrics that make sense and measure your progress.
Your Business Type and Industry
Different industries may prioritize metrics based on their specific goals and customer journeys. For example, e-commerce businesses may focus on conversion rates and average order value, while content-based websites may emphasize engagement metrics such as time on page.
Stay Informed
Also, check out this HubSpot study. It’s got the lowdown on the most popular advanced web analytics metrics that people are tracking. It can give you a solid starting point and some ideas to consider.
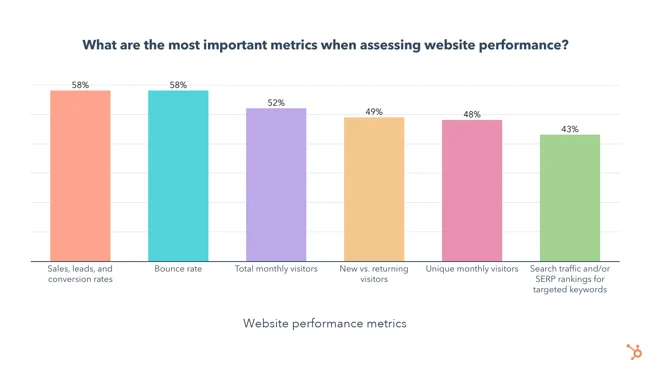
Source: HubSpot
Remember, the name of the game is getting insights that you can use to make smart decisions. So, don’t stress about tracking a gazillion metrics. You can start with the ones in the image and then adapt them according to the above.
Final Thoughts
So, there you have it, our fellow data-driven hustlers. We’ve explored the world of web analytics metrics in GA4, and now it’s time to take action. Although you wouldn’t want to use all these metrics, at least half of them should be included in your strategy for analyzing your company’s marketing performance.
As we mentioned before, remember data is the game’s name, and with Google Analytics by your side, you’re equipped to dominate the online realm like a boss.